Материал: ABC-of-Rheumatology-ABC-Series-
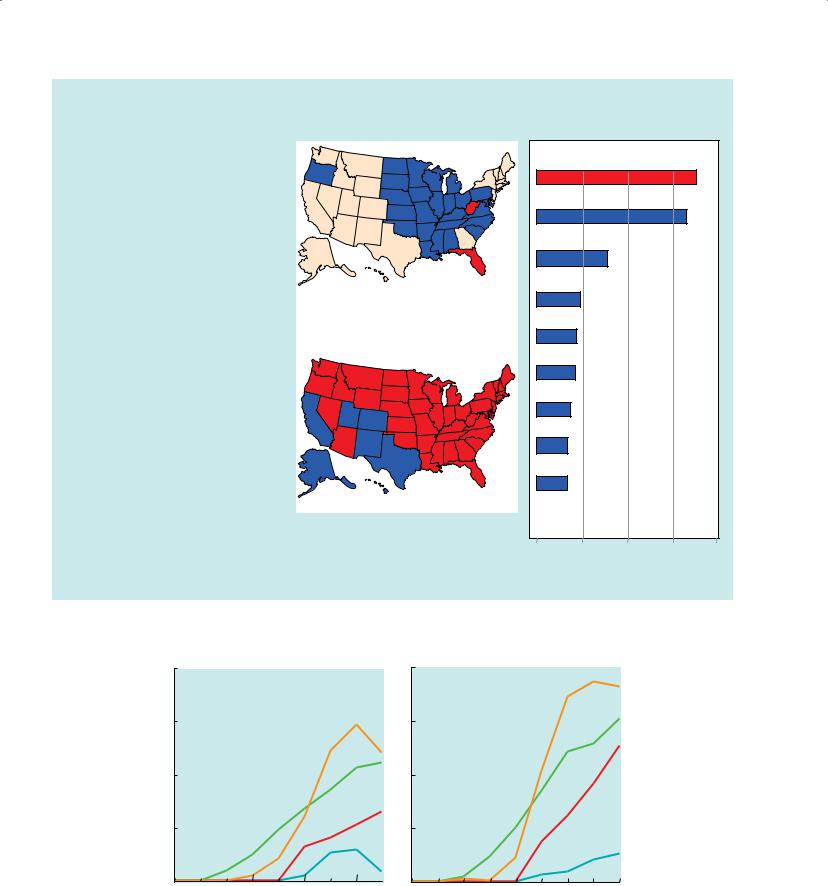
Arthritis (2005) in the
United States
|
|
|
|
|
|
|
|
|
|
By Age |
|
|
|
|
|
|
|
|
|
|
All ages |
48.3 million |
|
|
|
|
|
|
|
|
|
|
|||
|
|
Ages 18–44 |
8.6 million |
||||||||
|
|
||||||||||
|
|
|
|
|
Ages 45–64 |
21.3 million |
|||||
|
|
|
|
|
|||||||
|
|
|
|
Ages 65 and older |
18.4 million |
||||||
|
|
|
|
||||||||
|
|
|
|
|
|
|
|
|
|
|
|
|
|
|
|
|
|
|
|
|
|
|
|
|
|
|
|
|
|
|
|
By Gender |
|
||
|
|
|
|
|
|
|
|
|
|
Women |
38.2 million |
|
|
|
|
|
|
|
|
|
|
||
|
|
|
|
|
|
|
Men |
25.7 million |
|||
|
|
|
|
|
|
|
|||||
|
|
|
|
|
|
|
|
|
|
|
|
|
|
|
|
|
|
|
|
|
|
|
|
|
|
|
|
|
|
|
|
|
|
By Region |
|
|
|
|
|
|
|
|
Northeast |
12.9 million |
|||
|
|
|
|
|
|
|
|||||
|
|
|
|
|
|
|
|
|
Southeast |
15.9 million |
|
|
|
|
|
|
|
|
|
|
|||
|
|
|
|
|
|
|
|
Midwest |
14.1 million |
||
|
|
|
|
|
|
|
|
||||
|
|
|
Southwest |
5.9 million |
|||||||
|
|
|
|||||||||
|
|
|
|
|
|
West |
10.4 million |
||||
|
|
|
|
|
|
||||||
|
|
|
|
|
|
|
|
|
|
|
|
(a)
People with Arthritis 1990 and 2005
1990
|
|
|
|
|
< 15% |
|
15–18% |
> 18% |
|
2005
By 2030, as the baby boom generation ages, an estimated 75 million Americans will be affected by arthritis.
Leading Causes of
Disability Among Persons
Age 18 Years and Older
Arthritis or rheumatism
Back or spine problem
Heart trouble
Lung or respiratory problem
Deafness or hearing problem
Limb/extremity stiffness
Mental or emotional problem
Diabetes
Blindness or vision problem
Stroke
|
|
|
|
|
|
0% |
5% |
10% |
15% |
20% |
|
Percentage of all disability
Age-specific OA prevalence (%)
Men
OA prevalence (%)
80 |
|
|
|
|
|
|
|
|
60 |
|
|
|
|
|
|
DIP |
|
|
|
|
|
|
|
|
|
|
|
|
|
|
|
|
|
MTP1 |
|
40 |
|
|
|
|
|
|
|
|
|
|
|
|
|
|
|
Knee |
|
20 |
|
|
|
|
|
|
|
|
|
|
|
|
|
|
|
Hip |
|
0 |
|
|
|
|
50 |
60 |
70 |
80 |
0 |
10 |
20 |
30 |
40 |
||||
(b) |
|
|
|
|
|
|
Age (yrs) |
|
Women
OA prevalence (%)
80 |
|
|
|
|
|
|
DIP |
|
|
|
|
|
|
|
|
|
|
60 |
|
|
|
|
|
|
MTP1 |
|
|
|
|
|
|
|
|
Knee |
|
40 |
|
|
|
|
|
|
|
|
20 |
|
|
|
|
|
|
|
|
|
|
|
|
|
|
|
Hip |
|
0 |
|
|
|
|
|
|
|
|
0 |
10 |
20 |
30 |
40 |
50 |
60 |
70 |
80 |
Age (yrs)
Figure 9.1 (a) Prevalence of OA in the US and disability figures overall. Data derived from the Behavioral Risk Factor Surveillance System Survey Data, Morbidity and Mortality Weekly Report and US Census (CDC, 2001, 2005, 2006, 2007). (b) Age-specific OA prevalence by joint site. Adapted from van Saase et al., 1989, with permission of the publisher, BMJ Publishing Group. DIP = distal interphalangeal joint of the hand; MTP1 = first metatarsal phalangeal joint of the foot
Osteoarthritis 53
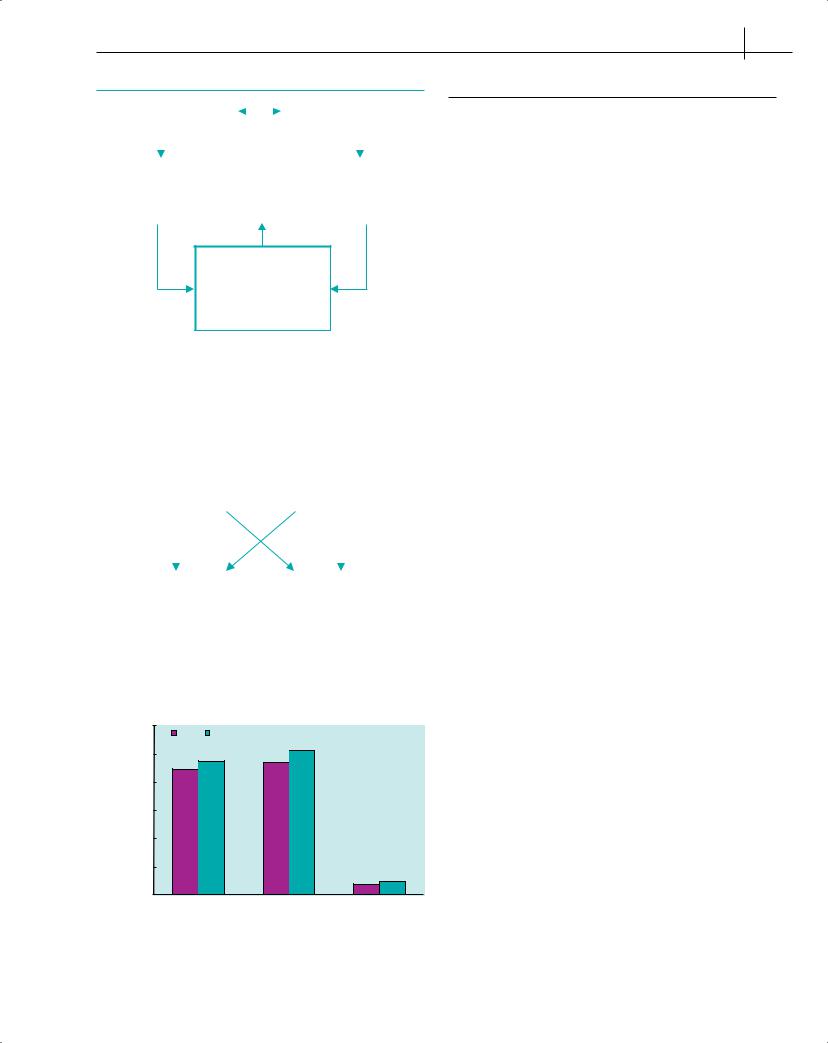
Pathways to osteoarthritis
Abnormal stress |
|
|
|
|
|
|
|
Normal stress |
|
|||||
Normal joint physiology |
|
|
|
|
|
|
|
Abnormal joint physiology |
|
|||||
|
|
|
|
|
|
|
|
|
|
|
|
|
|
|
|
|
|
|
|
|
|
|
|
|
|
|
|
|
|
|
|
|
|
|
|
|
|
|
|
|
|
|
|
|
|
Obesity |
|
Joint |
|
|
Ageing |
|
|||||||
|
Trauma |
|
|
|
Sepsis |
|
||||||||
|
|
destruction |
|
|
|
|||||||||
|
Bone remodelling |
|
|
|
Inflammation |
|
||||||||
|
|
pain |
|
|
|
|||||||||
|
Abnormal anatomy |
|
|
|
Genetic factors |
|
||||||||
|
|
disability |
|
|
|
|||||||||
|
Altered joint loading |
|
|
|
Biomaterial fatigue |
|
||||||||
|
|
|
|
|
|
|
|
|
|
|
||||
|
|
|
|
|
|
|
|
|
|
|
|
|
|
|
Cell/matrix injury
Aberrant repair response
Enzymatic degradation
Collagen disruption
Proteoglycan loss
Mechanical failure
Figure 9.2 Pathways to osteoarthritis. Taken from Poole et al. 2007, with permission of Dr Farshid Guilak and the publisher, Lippincott Williams & Wilkins
Aetiology of osteoarthritis and rheumatoid arthritis
Genetic |
|
|
|
Environmental/ |
||||||
|
|
|
biomechanical |
|||||||
predisposition |
|
|
|
|||||||
|
|
|
triggers |
|||||||
|
|
|
|
|
|
|
||||
|
|
|
|
|
|
|
|
|
|
|
|
|
|
50% |
Injury |
|
|
|
|
||
|
|
|
|
|
|
|
|
|
|
|
|
45–65% |
|
|
|
|
|
|
|
|
|
|
|
|
Smoking |
|
||||||
|
|
|
|
|
|
|
|
|
||
|
|
|
|
|
|
|
|
|
|
|
|
|
|
|
|
|
|
|
|
||
Joint degeneration |
|
|
|
Autoimmune |
||||||
non-autoimmune |
|
|
|
disease |
||||||
|
|
|
|
|
|
|
|
|
||
|
OA |
|
|
|
RA |
|||||
Figure 9.3 Aetiologies of OA and RA
Table 9.1 Important risk factors for osteoarthritis
Risk factor |
Notes |
|
|
Genetics |
Hand, knee and hip OA show strong heritability |
|
(40–60%); this probably results from combinations of |
|
multiple common polymorphisms rather than rare single |
|
genes with a large individual effect |
Race |
Knee OA is prevalent across the world, whereas hip OA |
|
is particularly prevalent in Caucasians |
Age |
Although not an inevitable consequence of ageing, OA |
|
is strongly age-related; this may reflect the cumulative |
|
effect of insults to the joint, aggravated by decline in |
|
neuromuscular function, or senescence of homoeostatic |
|
repair mechanisms |
Sex |
Women have a higher prevalence and radiographic |
|
severity of OA at all joint sites apart from the hip. |
|
Women are also more likely to have symptoms if |
|
radiographic OA is present |
Obesity |
This is an important risk factor for knee OA, but a more |
|
modest risk factor for hip and hand OA |
Bone density |
High density is a risk factor for development of knee, |
|
hip and hand OA; low density is a risk factor for more |
|
rapid progression of knee and hip OA |
Abnormal joint |
Acetabular dysplasia is a recognized cause of hip OA, |
shape and |
and distal femoral dysplasia (often overlooked) may |
alignment |
contribute to knee OA; varus or valgus malalignment |
|
may be a risk for development and more rapid |
|
progression of knee OA—this can have a major |
|
interaction with obesity |
Joint trauma and |
Major joint injury is an important factor at the knee |
usage |
(especially if it causes subchondral fracture, meniscal |
|
injury or ligament rupture) and can cause OA at any |
|
site; recognized occupational hazards include farming |
|
(hip OA), underground mining (knee OA), professional |
|
soccer (knee OA) and some heavy manual jobs (hand |
|
OA) |
|
|
Percent <65 years severely disabled/unable to work
60.0%
50.0%
40.0%
30.0%
20.0%
10.0%
0.0%
Men |
Women |
51.0% |
|
47.5% |
|
||
47.0% |
|
||
44.5% |
|
|
|
|
|
|
3.7% 4.5% |
OA |
|
RA |
No arthritis |
Figure 9.4 Relative work disability for OA and RA. Data taken from Pincus et al., 1989, based on 1978 US Social Security Survey of Disability and Work. In the original paper, OA and RA were referred to by their respective surrogates: asymmetric oligoarthritis and symmetric polyarthritis
resting (“gelling”), in the absence of systemic symptoms (fatigue, fever) or other system involvement. Joint stiffness arises, at least in part, from the accumulation of hyaluronan (a joint lubricant and the most abundant constituent of synovial fluid) and hyaluronan fragments in the deep layers of arthritic synovium during periods of rest, excluding water within the synovial tissue. Joint movement mobilizes hyaluronan from the tissue to the lymphatics and blood with attendant hydration of synovial tissue and improvement in joint stiffness symptoms (Engstrom-Laurent, 1987). The cartilage changes that accompany OA encourage deposition of crystals— both calcium crystals (calcium pyrophosphate and basic calcium phosphates), especially at the knee, and urate crystals. Patients with OA may therefore develop superadded acute pseudogout (mainly knees and wrists), and are at increased risk of secondary gout if they are on long-term diuretics or have chronic renal impairment (see Chapter 10).
54 ABC of Rheumatology
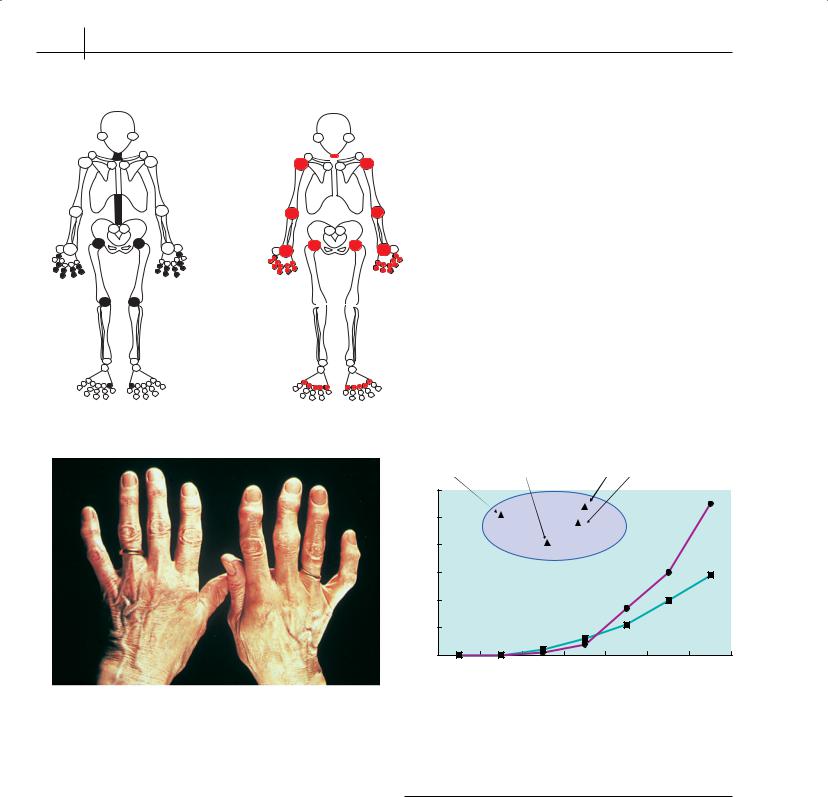
Distribution of primary OA and RA
(a) |
(b) |
|
Figure 9.6 Hands with Heberden’s nodes (bony enlargement of distal interphalangeal joints) and Bouchard’s nodes (bony enlargement of proximal interphalangeal joints)
Examination
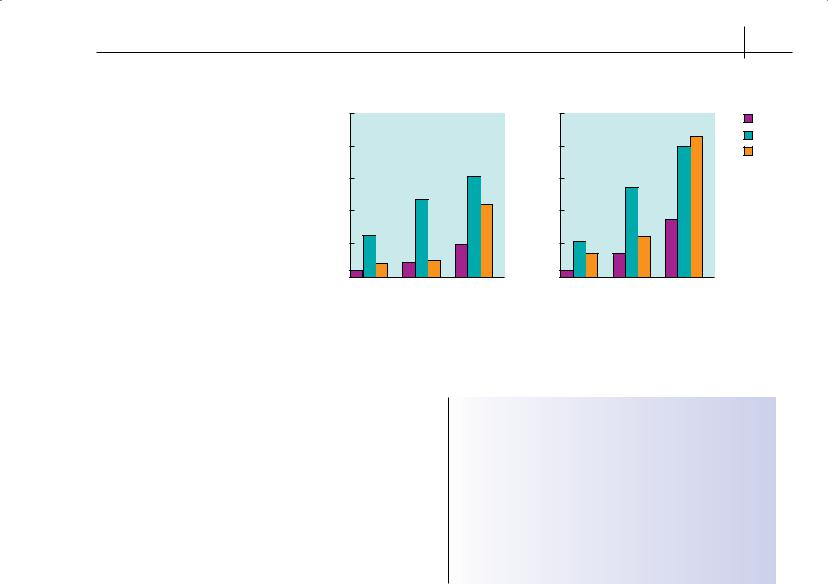
The main clinical features of OA are symptoms, functional impairment and signs. Considerable discordance can exist between these three (Figure 9.8). Pain may arise from several sites in and around an osteoarthritic joint (Table 9.2). Suggested mechanisms include increased intra-capsular and intra-osseous pressure, subchondral microfracture and enthesopathy or bursitis secondary to muscle weakness and structural alteration. Severity of pain and functional impairment are greatly influenced by personality, anxiety, depression, daily activity and reduced muscle strength and proprioception (muscle performs an important proprioceptive role).
 OA
OA
 RA
RA
Figure 9.5 Pattern of joint distribution of primary OA and RA
|
Women soccer ACL |
Men soccer ACL inj |
Men & Women meniscus |
|
inj 12 y follow-up |
14 y follow-up |
inj 15–20 y follow-up |
%OA |
60 |
|
|
|
|
|
|
|
50 |
|
|
40
30
20
10
0
15–24 |
25–34 |
35–44 |
45–54 |
55–62 |
65–74 |
75–84 |
Age class
Figure 9.7 Prevalence of knee OA after injury compared with baseline risk. Taken from Roos, 2005, with permission of Dr Ewa Roos and the publisher, Lippincott Williams & Wilkins
Table 9.2 Types of joint pain in OA
Nature of pain |
Probable aetiology of pain |
|
|
Pain with use |
Mechanical joint damage, enthesopathy from |
|
ligament or ligamentous attachments |
Pain at rest |
Inflammation with effusion and joint capsule |
|
distension |
Pain at night |
Intra-osseous hypertension |
Sudden flare of pain |
Crystal synovitis, torn meniscus, exacerbation of |
|
cartilage breakdown due to abnormal stressor |
|
with secondary synovitis from pro-inflammatory |
|
cascade due to release of cartilage matrix |
|
fragments; consider sepsis as a rare possibility |
|
|
Osteoarthritis 55
Figure 9.8 The discordance between radiographic OA and symptoms in the hands (distal interphalangeal joints, knees and hip). Taken from Arden and Nevitt, 2006, with permission of Drs Nigel Arden and Michael Nevitt and the publisher, Elsevier
Pain and radiographic OA
Prevalence of pain (%)
Men
100
80
60 |
|
|
40 |
|
|
20 |
|
|
0 |
2 |
3–4 |
0–1 |
||
|
Radiographic grade |
|
Prevalence of pain (%)
Women
100
DIPS
80 |
|
Knee |
|
Hip |
|
|
|
|
60 |
|
|
40 |
|
|
20 |
|
|
0 |
2 |
3–4 |
0–1 |
||
|
Radiographic grade |
|
Crepitus, bony enlargement, deformity, instability and restricted movement may occur together and predominantly reflect structural changes. Varying degrees of synovitis (warmth, effusion and synovial thickening) may be superimposed, especially noticeable in knees, and muscle weakness or wasting is extremely common.
Assessment aims to establish the source of symptoms in each patient. When diffuse and generalized tender points are identified at tendon insertion sites, then the co-occurrence of fibromyalgia should be considered and attention to improving sleep be included in the management considerations. Only an adequate history and examination can determine how much structural and inflammatory change is present and how much these contribute to a patient’s problems.
Box 9.1 European and US Guidelines for management of OA
•The management plan must be individualized, taking into account the site and severity of OA symptoms, any co-morbidity, concurrent medications and patient acceptability
•Non-pharmacological treatments are central—drug treatments are adjuncts
•A core and option approach is required—all patients should be offered education, an exercise programme, advice to reduce adverse mechanical factors and paracetamol as the first oral analgesic to try; there is a wide range of other treatment options from which to select additional treatments, as required
Diagnosis
Typical OA can be diagnosed by history and examination alone. Currently the main investigation that can help confirm OA is the plain X-ray, with demonstration of characteristic structural abnor- malities—focal joint-space narrowing (due to cartilage loss), marginal osteophyte or “spur” formation and subchondral sclerosis of bone (Figure 9.9). It is increasingly recognized that biochemical abnormalities of the joint precede radiographic abnormalities by as much as decades. For this reason, much effort is currently being put into identifying more sensitive imaging modalities, such as magnetic resonance imaging, bone scintigraphy and ultrasound, along with biochemical indicators in blood, urine or synovial fluid, that might identify and quantify OA more precisely and earlier than by X-ray.
Management
The goals of medical management of OA (summarized in Figure 9.10) are to: (a) provide patient education and information access;
(b) relieve pain; (c) optimize function; and (d) minimize disease
progression. See Box 9.1 for European and US guidelines on management of OA.
Symptoms of OA often are episodic. It is therefore advisable to provide the patient with an armamentarium of treatment options to choose from during periods of relative quiescence and relative flare.
Patient education and information access
This is a professional responsibility, but education also improves outcome and is a treatment in its own right. The myth that OA is a progressive wearing-out of joints due to old age still persists; this invariably leads to inappropriate reductions in activity. A major contribution to managing OA has been the finding that a patient’s psychological status (anxiety, depression and social support) is an important determinant of symptomatic and functional outcome. Good evidence supports the use of educational programmes to help patients understand OA and develop self-management strategies.
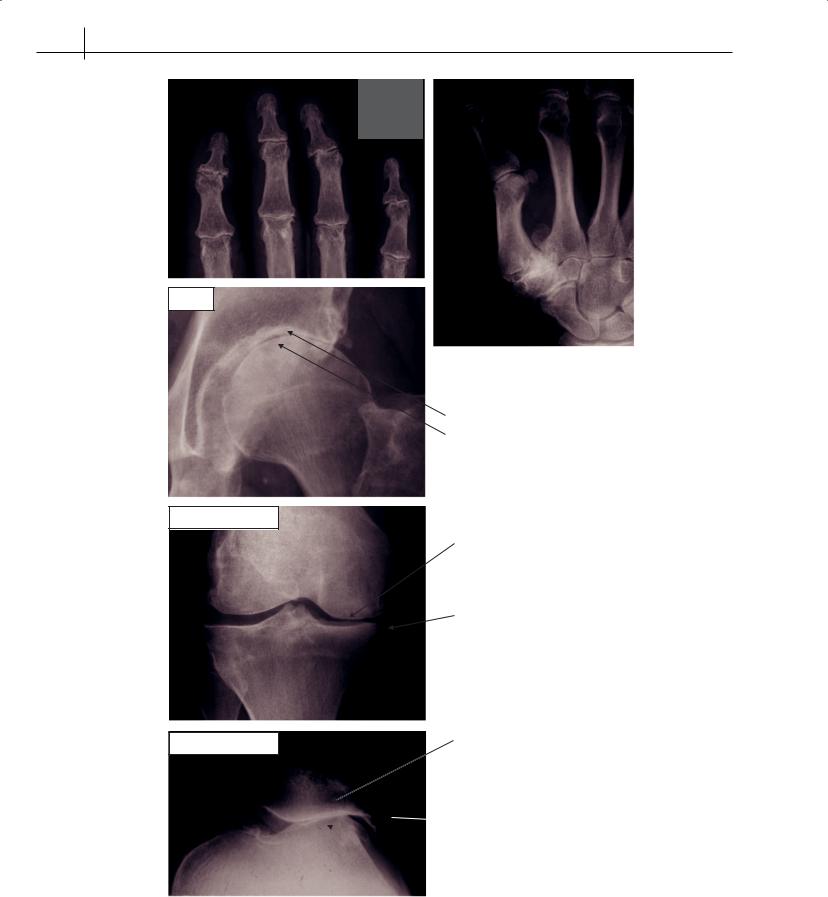
56 ABC of Rheumatology
(a)
Hip joint
(b)
Tibiofemoral knee joint
Patellofemoral knee joint
Sclerosis
Joint-space narrowing
Joint-space narrowing
Osteophyte
Sclerosis
 Osteophyte
(c) Joint-space narrowing
Figure 9.9 Radiographic OA: representative images of a hand (a), a hip (b) and a knee (c) with radiographic OA