Материал: chapter V
|
|
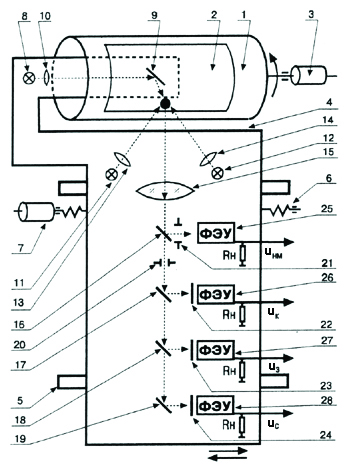 Figure
5.8 Four-channel color separating device with mounting of slides
and reflection originals on a transparent drum
Figure
5.8 Four-channel color separating device with mounting of slides
and reflection originals on a transparent drum
In the PMT 26, 27 and 28 loads of the main optical channels, color-separated (RGB) signals are formed. Their amplitude depends on the intensity of the light flux averaged over the aperture diaphragm 20 and the integral reflection (transmission) of the original, respectively, in the red, green and blue regions of the visible spectrum.
The optical density of the semitransparent mirrors 16.17 and 18 is selected from the condition of approximate equality of the signal amplitudes from the neutral gray field at the outputs of all four PMT, taking into account the diaphragms 20 and 21 sizes.
Single-channel systems using only one PET are the most stable in terms of their output signal balance. They generate RGB signals sequentially by elements or by lines. To filter the light coming from the original in time sequence, they use the effect of changing the crystal transmission spectrum under the influence of the applied electric field [5.3]. Such single-channel system had, in particular, Linoscan 3040 [5.4].
5.2.5 Spectral sensitivities of an image capturing device
The amplitude of each of the three color-separated signals received at the PMT 26, 27, 28 outputs behind the broadband (spectral) RGB filters 22 - 24 is determined by the spectral sensitivity η(λ) of the corresponding PMT and the spectral content of the light entering it. As can be seen from the scheme in figure 5.8, the latter depends in turn not only on the spectral reflection ρ(λ) of the sampled original area but also on the spectral power distribution of illumination p(λ), spectral transmission τt(λ) and reflection τr(λ) of dichroic mirrors, transmissions α(λ), β(λ), γ(λ) of color filters in three optical channels. As the expressions 5.4 show, the instantaneous values of these signals are proportional to the area under the curve obtained by multiplying all these spectral curves:
|
|
5.4 |
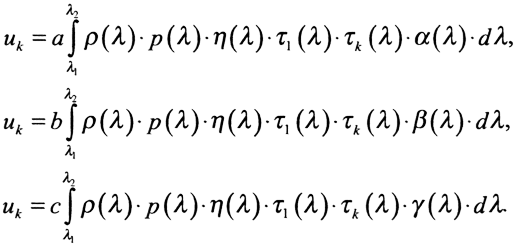
The integration bounds correspond here to the spectral sensitivity range of the photo detector, and the dimensionless coefficients a, b, c ensure the equality of the color-separated signals for the neutral, achromatic fields of the original. In practice, this balance is achieved by adjusting the light intensity in optical channels with gray filters of variable optical density and adjusting the gain of the output signals.
With the exception of the original reflection ρ (λ), the products of the remaining factors of above expressions represent the spectral sensitivity characteristics of the color separating channels.
Subsequent nonlinear transformations of color-separated signals are accompanied by losses due to the effecting of the reproduction system noise. In order to eliminate or minimize such transformations, the sensitivity characteristics of the three channels must correlate to those of the originals and their intended display media.
Quite often argue that scanners work in a certain "RGB color model". However, in order to the color-separated signals represent the color coordinates of any colorimetric system, the spectral sensitivities of scanner channels must correspond to the so-called Color Matching Functions (CMF) for such system primary colors. Any set of real primaries is corresponded by CMFs having sufficiently extended areas of negative values. So, the “negative” sensitivities are required to directly produce, for example, the RGB signals of the CIE RGB system of monochromatic (700; 546.1 and 435.8 nm) primaries. They can be obtained just indirectly, for example, by calculating them from CIE XYZ ones related to positive CMFs of virtual, unreal primaries [5.5].
Most scanners, as will be noted further, do not work colorimetric but as densitometers, carrying out the color separation in three wide spectral bands (red, green and blue) of the visible spectrum.
Selection of spectral sensitivities for color channels can take into account:
- spectral characteristics of the dyes for the used type of originals (photographic prints, transparencies or negatives; prints of conventional, toner based, thermal transfer or other kind of printing);
- characteristics of process colors in the intended image copying (on the monitor, by photographic recording, conventional or digital printing, etc.);
- light spectrum used for the copy viewing.
Then the values of the signals are more closely related to the colors of synthesis (amounts of inks, phosphors or LEDs intensities, etc.) and do not need significant additional nonlinear transformations, fraught with loss of information. Such characteristics are provided by the proper selection of color filters with calculation their transmission spectra according to equation 5.4.
For many years, until the color management creating for open reproduction environment, there were successfully used densitometric scanners. Their sensitivity characteristics are close to the absorption spectra of pigments of photographic originals and printing inks. So, acceptable was a direct, via Color Look-up Table (CLUT) conversion of red, green and blue channels signals in the process inks amounts without going to the colorimetric metrics. As will be shown in chapter 10, such kind of color separated signals processing stays effective until now for the closed, direct (one input – one output) systems.
5.3 Output equipment
5.3.1 Methods and means of an image output
There are more or less successful attempts to classify methods and means of obtaining intermediate and final images in the reproduction [5.6; 5.7]. However, the dynamics of development in this area in recent decades has been so high that now and then there are appeared new technologies and it often turns out that they do not fit into one or another pre-developed scheme of specification.
The approach based on the assignment of a detailed name to a particular tool, which, characterizing its features, allows to determine its place among others, is also ineffective for systematization. Used in wide practice the names of the various graphic methods and devices are for the most part uninformative, highly contingent and riddled with professional jargon and advertising persuasion.
For example, the term "digital color proof" is relatively capacious, because it indicates both the purpose of the image and the source of its production as an coded numeric array. However, behind the scenes there are important aspects related to the type of used physical process and material, the structure of the image, etc. In the concept of "analog color proof", the generally accepted meaning of the first word indicates the way of representation of the electric signal. In fact, there is no such signal in this technology at all for the source data is comprised by color separated halftone transparencies.
Little informative and does not reflecting the essence of the device construction is today often the adjective "digital". For example, the design of a “digital scanner” is only completed by an analog-to-digital converter or processor that forms a digital file. The digital printer, on the contrary, begins with the digital-to-analog converter and the final impact on the printed material is controlled by analog currents and voltages of rather great power.
It is often more productive than the classification itself to combine the features underlying it into homogeneous groups, for example, on such signs as:
- image production purpose;
- nature of its structure;
- physical process used;
- material applied;
- type of source information, etc.
By its purpose, intermediate images obtained in the illustrative printing may be:
- printing plate;
- halftone transparency;
- “hard” or “soft” proof;
- reproducible layout, etc.
Traditional processes of transfer of full-format intermediate copies on a transparent and opaque substrate (transparencies, pigment paper, etc.) to the printing plates are described in detail and systematized in the literature [5.6; 5.8; 5.9]. So, there are considered below only those where the source image data is presented by an electric signal in its analog or digital form.
Such signal controls the laser or LED radiation to create or update a latent electrographic image for each print within a run in some methods of digital printing (Computer-to-Print). Similar signal is used in the Computer-to-Plate concept, which had, in some other form, place long before the computer prepress technologies. Recording of transparencies undermines, in turn, the traditional plate making as a mandatory follow-up phase. The “hard”- and “softproof” can be obtained as with the mechanicals, and using electric image signal.
The image obtained as a result of the prepress operations can have a linework (LW), continuous tone (CT) and halftone structure.
The category of LW images includes films, plates and proofs containing text, drawings and other binary images, such as engravings.
CT transparencies were used in plate making for collotype and gravure printing. In fact, the CT structure is inherent in some kind of color proofs produced, for example, by recording on a photo sensitive paper.
In the vast majority of images on films and plates of monochrome and multicolor printing, as well as on the high-level hardproofs (true proofs) are halftones using the autotype principle of a continuous tone simulation.
A significant distinguishing feature of image output technology is the nature of the physical impact on the material of the copy. It can use the "contact" and be "non— impact " (NIP-Non-Impact Printing). In this sense, there are also:
-electro-mechanical and laser engraving;
- photographic, electrophotographic, electrographic, magnetographic, inkjet, etc. recording;
- transfer of the dye from the donor tape, its thermal sublimation, electrolytic deposition on the substrate, etc.
An important feature is the type of material on which a particular kind of a copy is formed prior to the print run. In these purposes the metals and their alloys, photographic film and paper, photopolymers, plastics, etc. are used. Sensitive layers of transparencies and plates can use silver or, without it, be five or six orders of magnitude less sensitive.
The above features are combined in a variety of ways in a great number of obsolete, existing and emerging prepress technologies. Consider below only some characteristic examples.