Материал: Homework_1_(Electrostatics)_What_to_do
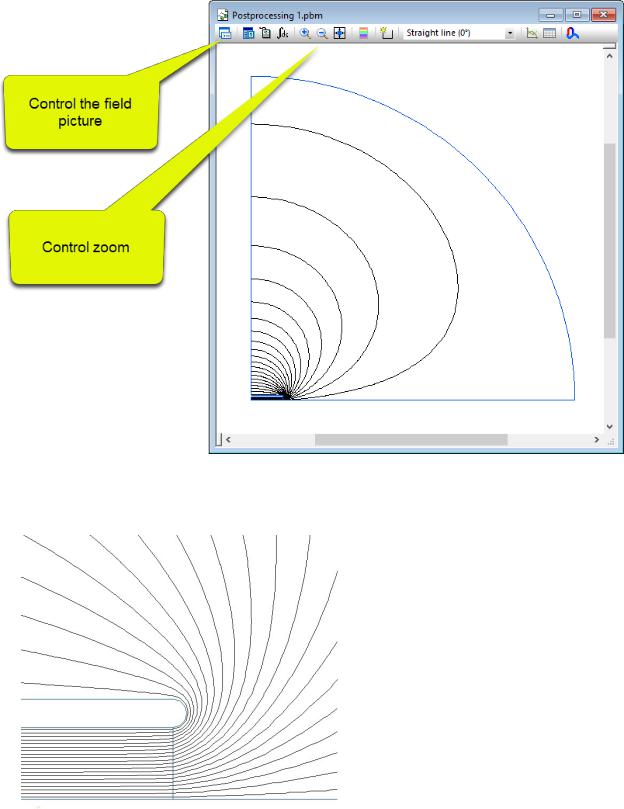
Zoom in to the area of interest – in our study it is the right corner of the capacitor’s plate:
16
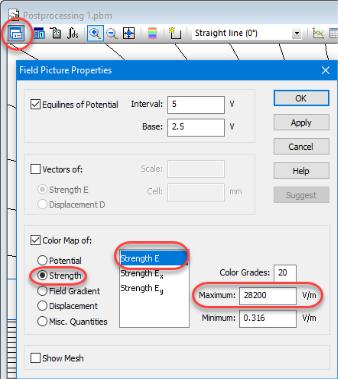
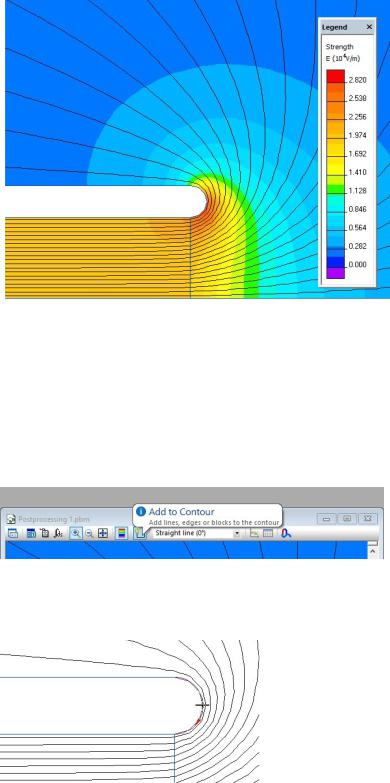
Now tune the field picture to show the color map of E-field magnitude:
To activate the Field Picture Properties dialog, click the leftmost button on the field picture toolbar and in the dialog appears select Color Map and then choose the physical quantity to show – the magnitude of the field strength vector E. The Maximum input field automatically shows you the maximal value of the chosen quantity over the entire model. Now it is E =28.2 kV/m.
17
2.8.XY-PLOT AND TABLE ALONG THE CONTOUR
QuickField can plot and tabulate the field values along the user’s contour. A contour is basically a line or polyline that can be open or closed. The contour consists of one or many parts. Each part is either a free line or a predefined edge of the model.
Let’s build a one-part contour that is simply the semicircular end of the conductor. Enter the contour mode by click to the Add to Contour button
And click by the cross-shaped cursor to the edge of interest:
18
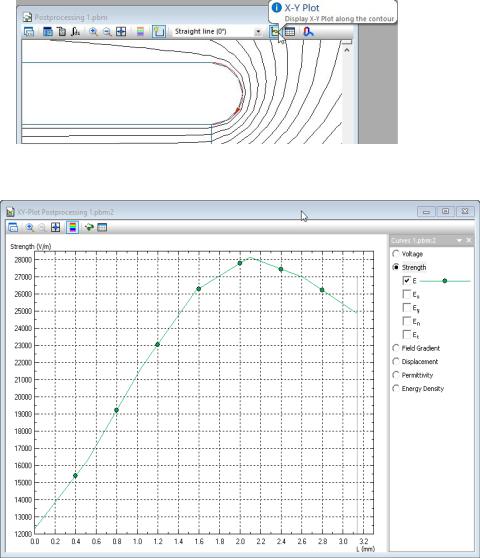
The edge appears in red color with the direction arrow is now the contour suitable for plotting, tabulating and integration. The XY-Plot button brings the XY-Plot, and the Table button opens the window with a field tabulated over the contour.
On the above picture the XY-Plot button and the XY-plot window are shown. The next button on the same toolbar shows field values along the contour in form of table.
To obtain the maximum electric field value EMAX and the position where the maximal field arises, is recommended to use the table of field values along the contour. By default, the table contains a lot of columns with all known field quantities, and 21 evenly distributed rows:
19
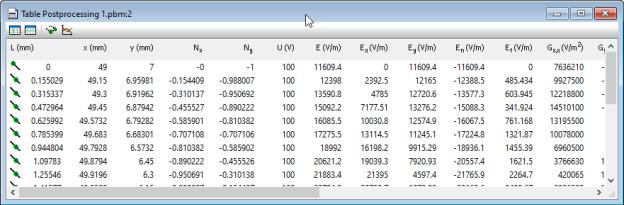
The two leftmost buttons on the table toolbar allow to control table columns and rows:
20