Материал: chapter IV
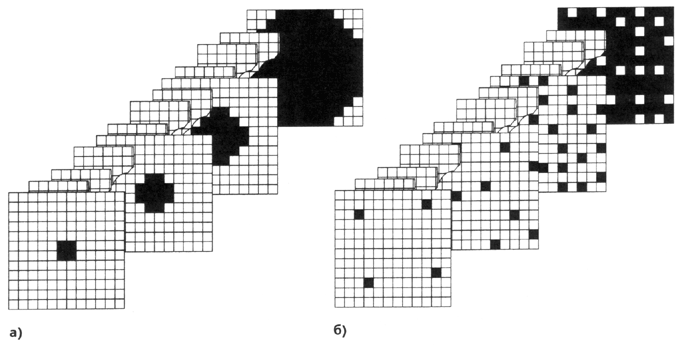
Figure 4.10. Representation of the print elements alphabet by bitmaps with ordered (a) and random (dither) (b) distribution of sub-elements (microdots) within the screen mesh
The dot alphabet can also be represented by a single matrix of weight values in the dimension of a uniform tone signal. Such values can be distributed here in an orderly or irregular manner. A greater number of visually equidistant gradations provide distributions, “screen hills” with weights monotonically decreasing or increasing from the center to periphery of the matrix and corresponding on a print to dots and gaps with minimal perimeters. An example of such distribution within the 8x8 subelements period of screen function is shown in figure 4.11(a, b).
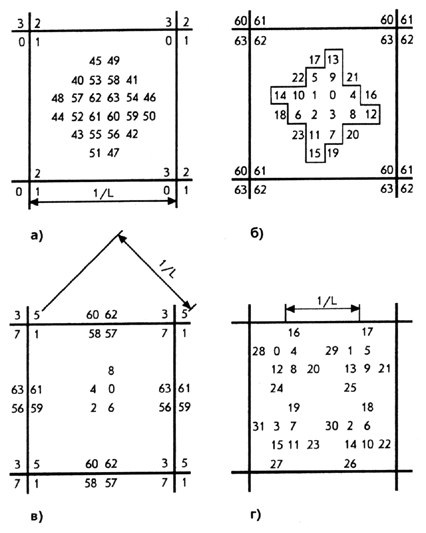
Figure 4.11. Options for grouping of recorded microdots within the screen spatial period: a - screen "hill"; b - screen "crater”; c - for a 45° angle screen of √2 times greater ruling; g - of the twice higher screen ruling at 0°
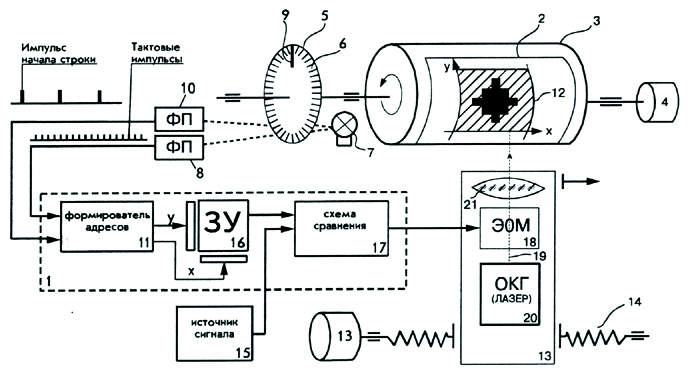
In the electronic dot generator (EDG), the current value of the image signal is compared with the weight of the element under the exposing beam during recording. As the result of the comparison, a signal is produced that allows or prevents the beam from affecting this element of the substrate in one way or another. The operation of such a generator 1 in the block diagram of the output device is explained in figure 4.12. |
|
Figure 4.12. Electronic dot generator The copy material, such as high-contrast film 2, is fixed on a drum 3 rotated by a motor 4. On the axis of the cylinder 3, a transparent disk 5 is installed with opaque stripes 6, the step of which corresponds to the material 2 movement around the drum 3 by the size of a microdot. The light beam of the lamp 7 is interrupted by stripes 6 and in the load of the photoelectric transducer (PET) 8 a pulse clock signal is formed. Single stripe 9, interrupting the beam of the lamp 7 once per cylinder 3 revolve, creates at the PET 10 output a pulse signal of the line frequency. These signals are fed to the former 11, where by cyclic recalculation of the clock frequency pulses from the beginning of a line and the line frequency pulses from the first scan line the cells addresses X and Y are formed for the look-up table (LUT) 16 with the weight values of the microdots of image unit area 12. Here, the frequencies agreed with the cylinder 3 rotation are also obtained for the motor 13, which moves the recording head with the help of the lead screw 14, and for taking the original signal samples from the source 15. It can be the output of an electric communication channel, prepress image file or the like. If the reproduction is carried out in real time of the original image capturing in a scanner the latter of these frequencies is used for sampling in its analogue-to-digital converter (ADC). The number of elements for which the threshold values are recorded in memory 16 corresponds in this example to one spatial period of the screen function or one halftone mesh. It is also accepted for simplicity equal 8 x 8 and number of gradations (levels of tone range quantization) - 64. In practice, to obtain the required number of uniform gray steps, matrices of much larger volume and 256 levels of tone quantization are used. According to the addresses X and Y of former 11 the microdot weight value is output from the memory 16 to the comparator 17 input while the current signal value is supplied to its other input. As a result of the comparison, the electro-optical modulator 18 receives a signal allowing or prohibiting the laser beam 19 to pass through the lens 21 to the recorded substrate 2. The halftone dot formed in such a device by the sixteenth quantization level is, for example, indicated in figure 4.11 (b). The threshold value renewal is determined by the clock and line frequencies, while the image signal frequency depends on the sampling rate at capturing of an original or on the pixels density in its image file. These replacement periods are taken in this example equal and matching in phase with the period of weight function, and the latter, in turn, coinciding with the screen mesh. In general, and, for example, when the screen, as will shown below, is formed at some angle to scan lines, all these periods do not coincide. The algorithm for halftone structure formation in most screening programs is similar to this EDG operation.
4.3.4 Screen function As it was shown, the screen function is a two - dimensional periodic distribution of the weight values of the elements forming halftone dots and blanks on the copy. These values are expressed in the image tone quantization scale. Therefore, the size of the matrix representing one spatial period of such a function determines the discreteness of the second (after the ADC) quantization of the tone range. However, in a number the reasons, as explained in chapter 8, this scale is non-linear in respect of any of the tone representations, whether it is brightness, reflectivity, lightness, optical density, etc. The relationship between the values of the equal-contrast signal and the number of microdots forming the halftone dot is also nonlinear. Visually non uniform is, in turn, a step wedge, formed by dots, differing by the same number of such microdots. The same wedge is only theoretically linear with respect to reflection (absorption) coefficients on a print. The latter nonlinearity is redoubled as the decrease in absolute microdots size (as the resolution of the output growth). For these reasons, the matrix size should exceed the number of equal-contrast signal levels and comprise in practice up to 24 x 24 or even 30 x 30. So, the resolution of the output devices is much higher than the source files definition and reaches a 5000 dpi with the element size 5 microns. Weight values are grouped inside the matrix in different ways to form one or more clusters. In the first case (Figure 4.11, a, b) weights can change from the center to the periphery in the form of a "hill" or "crater" to obtain a single halftone dot or blank space.5 The resolution of the toner based and ink jet printing is relatively low and the matrixes take up too much space. The illusion of the higher frequency screen can be created by the grouping weights into a greater number of clusters. A simple example of a two-fold, with respect to the variants of figures 4.11 (a) and (b), ruling increase shows figure 4.11 (d). The weight values are distributed so that each of the four halftone dots formed in this period responds by changing its area by one microdot, respectively, for each first, second, third and fourth signal level. Another example that explains the formation of a screen structure with a ruling greater than 150 lines/inch (60 lines/cm) in a printer with a resolution of only 600 dpi (25 lines/mm) is illustrated in figure 4.13. The period of this function, covering 241 printer microdots, is divided into 25 clusters, each of which responses only to the corresponding, assigned to it 25th tone level [4.10]. Here, for clarity, only two clusters are fully populated, the rest of them are shown containing only the minimal of the cluster values. As can be seen from the drawing, the screen formed by this function is inclined by an angle with a rational tangent, well approximating the angle 150 (arc tg 4/15 ~ 14050’) used for cyan or magenta process ink.
|
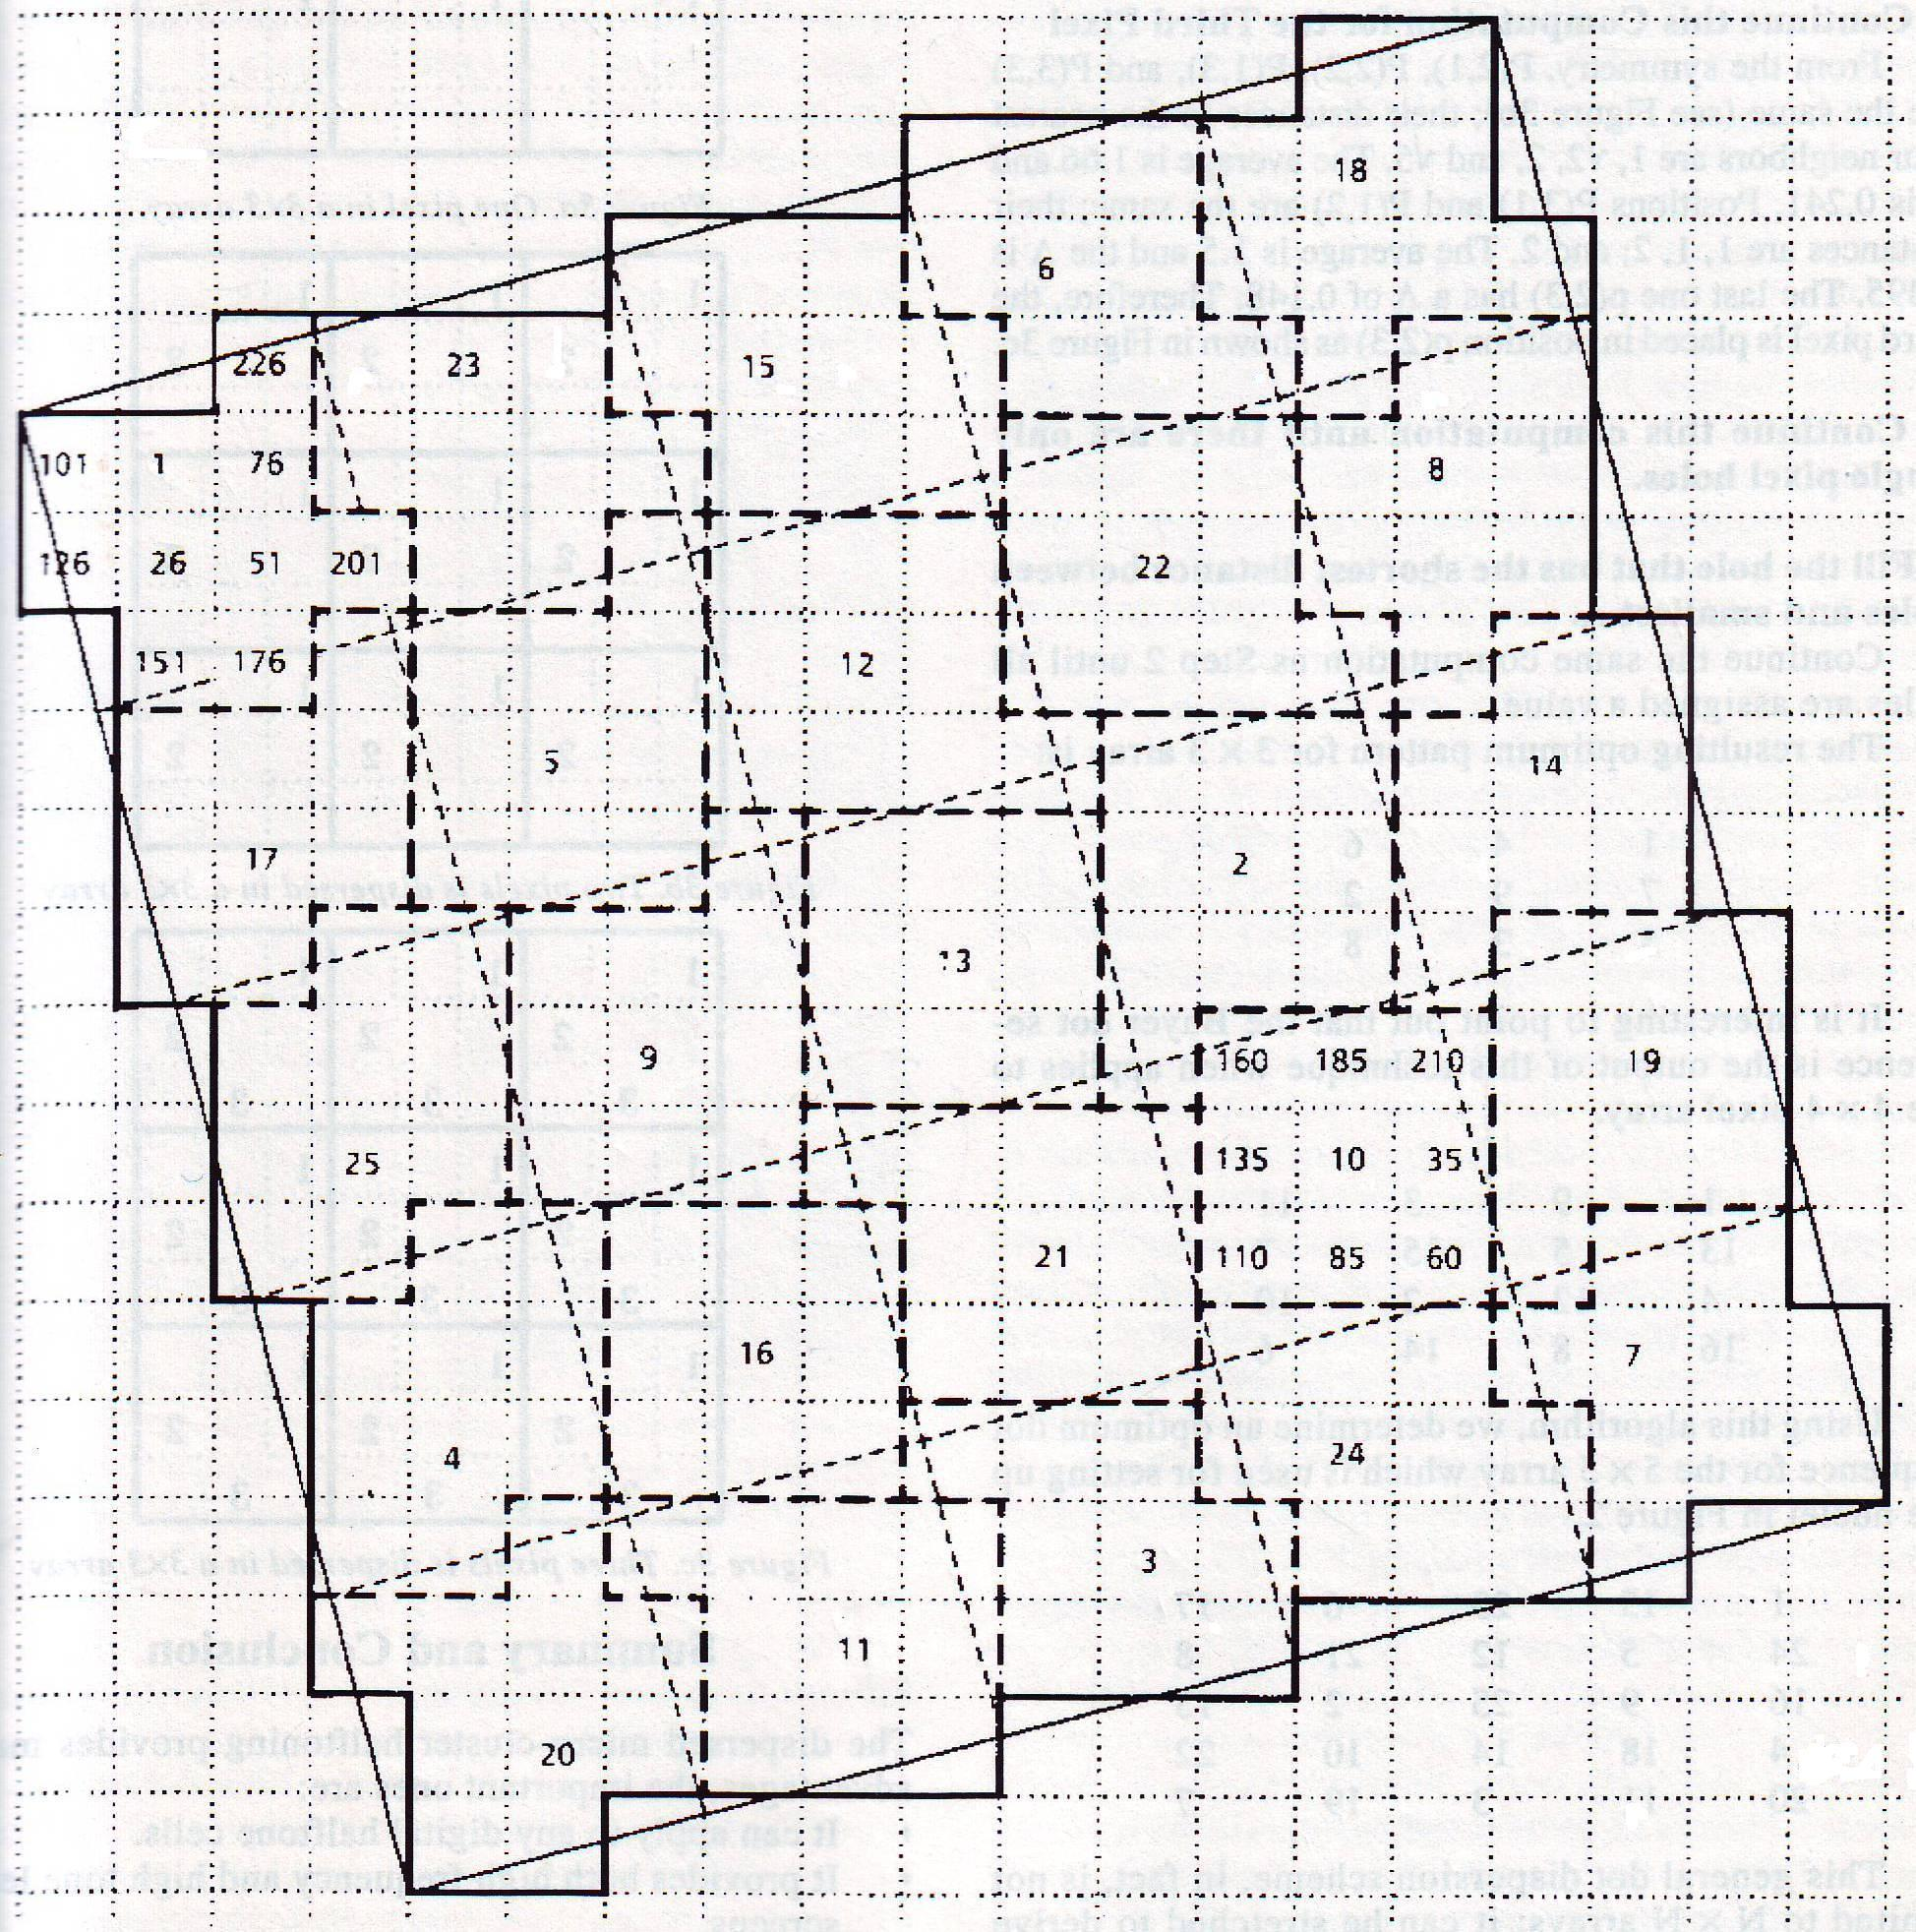 Figure
4.13. Grouping
weights for 25 clusters in one period of the screen function to
increase the halftone frequency in printer of small resolution
Figure
4.13. Grouping
weights for 25 clusters in one period of the screen function to
increase the halftone frequency in printer of small resolution
As can be seen from the microdots placement order of a unit copy area, given by the distribution in figure 4.13, the lightest gradation of an original is reproduced by the microdot 1, repeated on the print with the period of this function. The screen frequency gradually increases with the tone growth and reaches the nominal value at its 25th level, when at least one element is formed in each of the 25 clusters. Similarly, the frequency of the blank spaces gradually decreases in the shadows from 216 to the last 241 level. Thus, the structure of printed and blank elements formed by such a function has all the features of the above-mentioned hybrid screen, partly using the principle of FM screening, in which, as noted in [1.9], the contour sharpness also depends on its contrast. So, in this example, the printing system responds to the minimal tone jump (1/241 of a range) with the period of the screen function. For transitions greater of 25 levels, the frequency response growths about five times, i.e. up to equal clusters periodicity.
When weights are placed randomly in such a matrix, there are no large dots or blanks, and the screen is completely irregular. Its resolution is, however, similarly dependent on the detail contrast.
4.3.5 Form of a dot
The halftone structure can be completely defined by a single screen function, as well as in combinations of dots alphabet or spot function with the threshold function. Alphabet can be represented, in turn, by a set of bitmaps (Figure 4.10) or by defining the halftone dot shape with a separate matrix - spot function which cells numbers indicate only the order of the microdots inking as the dot grows, out of dependence on the signal value. Regardless of the shapes and relative position of the dot and blank, these values connection with the change in the ink coverage area inside the screen mesh provides a threshold function (Figure 4.14), which maps the alphabet symbol or microdots amount n in the matrix to the current signal value N.
|
|
|
Figure 4.14. Relation between the tone value S or the inked microdots amount n with the quantization level number N of the equi-contrast signal: for offset plates of positive (1) and negative (2) copying; for gravure (3) |
|
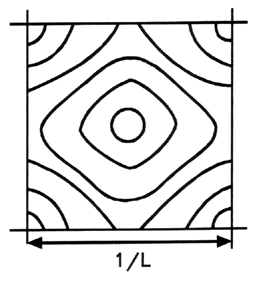
Figure 4.15. Iso-weight lines within the screen function period for providing the minimal perimeter of dots and blanks, as well as smoothing the tone jump at an adjacent dots touching in midtones
|
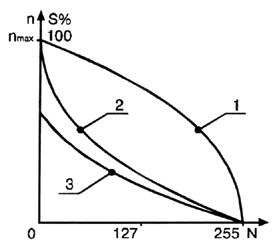
The shape of curves 1 and 2 in figure 4.14 corresponds to the logarithmic relationship between the visually uniform (proportional to the optical density) signal and the absorption as an ink coverage.
As shown in Table 1, the tone dispersion parameters, such as margins of its spatial bounds, continuity, linearity, discreteness, and direction (geometry), strongly correlate to related properties of a halftone structure or an image itself. Bounds of dispersion define, for example, the print screen period (ruling) finally affecting an image sharpness and definition.
Table 1: Parameters of tone scale spatial dispersion and properties of a thereby produced halftone structure
Dispersion parameter |
Halftone structure property |
spatial bounds |
screen period (definition) |
continuity |
AM, FM (stochastic) |
linearity |
tone response curve |
discreteness |
number of gray levels |
direction |
form of print element, screen geometry |
The analytical setting of screen geometry as a function of microdot coordinates is now more widely used. Due to its generalized form, such particular parameters as the screen ruling, angling and degree of dot ellipticity can be set in the RIP at the image output.
The form of dots and blanks has to ensure unambiguous, with minimal distortion, transmission their area (tone and color of the future image) from the bit map onto the film, plate, offset blanket, paper. Such distortions can occur due to the dot gain, printing parameters instability (within the technological tolerances), plate wear in long runs and for the other reasons.
Such requirements are best met by round elements as having a minimum perimeter for a given area. However, the transition from round elements of lighter colors to round blanks in the shadows as the growth of tone is not possible. Therefore, the most common is so-called Euclidean law of their form transformation. Round elements of highlights are gradually converted into square ones, getting a chessboard in middle tones. Its square spaces make round, moving further to deep shadows.
However, the simultaneous touch of neighboring dots at all four sides with a smooth increase in tone is accompanied by a noticeable jump [2.5]. In this regard, for medium tones their elliptic or rhombic form is rational, in which the contact occurs first, for example, at S = 45%, in one direction only on two sides, and then, for example, at S = 55%, in the transverse direction in the other two. The tone jump is thus split into two smaller ones and becomes less noticeable.
The degree of shape deviation for the dots from round or square is characterized by their ellipticity. For example, at its values 0.5; 0.6;... 1.0, the rhombic dots touch each other initially (in one direction), reaching an area of 25%, 30% ... 50%. According to ISO 12647, the direction coinciding with the larger size of the ellipse or rhomb is called the principle axis, relative to which the screen angle for one or another of the process inks is defined. Lines of the close weight values, taking into account the above considering for the halftone dots geometry, illustrates figure 4.15.
The threshold function is selected according to the type of printing and equipment, the specifics of obtaining intermediate copies on film or plate, etc. Examples of such dependencies are given in figure 4.14. The both axes scales, as schematically explains figure 4.16, are discrete. Therefore, in curve segments with a large slope 1, the signal change by one level is responded by adding several microdots, while in segments with a small slope 2 vice versa. If in the first case the number of halftone symbols is excessive in relation to the signal discreteness, but in the second case, due to the insufficient size of the matrix (amount of microdots), the values of signal neighboring levels are responded without ink coverage variation.
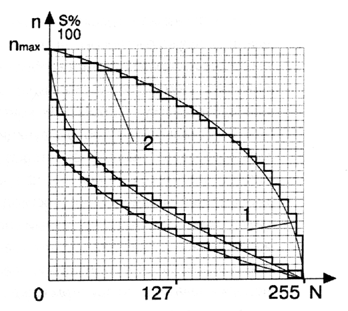
Figure 4.16. The size nmax of the microdots matrix is finite and therefore may be excessive (1) or insufficient (2) with respect to the quantized image signal N in different areas of the tone range
Curve 3 in the figures 4.14 and 4.16 shows that about the 30% of microdots is set on a gravure plate out of connection with the tone value to build between cells the partitions, which serve as a support for the squeegee (“doctor blade”), removing excess ink previous to contact with a paper.
Optimal screen function or form of such graphs is corresponded by the utmost uniform step wedge, which can be produced at given printing conditions. The criterion of equal contrast here can be the presence of just noticeable steps between all adjacent patches of the wedge. It can reach 16, 32 or 64 patches, depending on the paper quality and other parameters that characterize the noise level of a particular technology. If at the same time each of the subsequent patches is provided by each sixteenth, thirty-second or sixty-fourth level of the eight-bit signal it can be considered that this signal is also perceivably uniform.
In this case, the printing system is linear and is characterized by the minimum possible loss of gradations. Otherwise, for the complete use of a system tone rendition facilities, appropriate changes are made to the relationship between the quantization level (signal value) and the wedge patch numbers. To limit the loss of such a nonlinear correction allows more than double the signal levels number (256) over the amount of steps, separately reproduced in the most advanced printing technology.6
4.3.6 Error diffusion halftoning
Screening as a task of digital image signal processing is the transformation of an array of multi-level samples into a binary one. Being distracted from the above-mentioned technological aspects related to the geometry of a resulting bitmap, dot shape, screen orientation, etc., this process can be considered stochastic and the resulting binary image must correspond to the original with the probability determined by the multilevel value of its sample. If the ink coverage on a unit print area of 16 x 16 microdots is defined by the 57th level of the eight-bit input sample, then the bitmap for this area should contain 57 units and 256 - 57 = 199 zeros. The same microdots number is formed within this area respectively dark and light.
Two-level quantization of multi-level values at a given threshold is accompanied by an error in the form of a difference between the quantized and threshold values. Redistribution (diffusion) of this error between the surrounding samples gave the name and formed the basis of one of the directions of obtaining pseudo-continuous images, a priori characterized by an irregular structure [4.13]. It does not use the above-described front set screen functions or alphabets, and the binary value bij (0 or 1) is assigned to the microdot as result of the original value aij and the threshold h comparison.
A relatively complex calculation procedure slows down the RIP operation and the method is often used only for computation and loading pre-defined alphabets in non periodic screening.
A simple algorithm to convert the eight-bit values aij in a binary bij for a given in advance threshold h entails the assignment of error dij to the following in bypass of a numeric array multi-level sample aij+1:
aij › h, then bij = 1, dij = aij-256;
aij ≤ h, then bij = 0, dij = aij;
aij+1 = aij + dij 4.1
These conditions show that if the threshold h is accepted, for example, 127, then the assignment bij = 1 is error-free only when the initial value aij = 255. For its smaller meanings (from 127 to 255), assigning "1" to a binary readout is redundant. Then the error dij is estimated as the difference aij-256 and is accounted by its addition to the value of a next sample aij+1.
Similarly, bij = 0 is true only when aij = 0. For all other values less than the threshold, it is insufficient and is compensated by adding this value itself as an error to the next sample.
As in other screening methods, it is necessary to satisfy a number of contradictory conditions and, in particular, the requirements of smooth tone rendition with the structure uniformity and high (adequate sampling rate of the original) definition of the resulting binary image.
To eliminate unwanted microdot clusters or directional structures (“worms”) in advanced error diffusion methods [4.14 - 4.17], the following measures are used:
error is spread over the neighboring pixels more evenly, bypassing them, for example, "serpentine" (from the beginning to the end of one line and from the end of the next to its beginning);
distribute the error not only to the next element but also to the neighboring ones, using weight coefficients that take into account their proximity to the given one, as shown in figure 4.18;
eliminate the periodicity in the error propagation by pseudo-random modifying the process, e.g., by adding a certain amount of "noise" to the threshold h or to the source values aij;