Материал: chapter IV
я |
4. Screening
4.1 Tone measure spatial dispersion
4.2 Optical methods
4.2.1 Halftoning photo effect in screening
4.2.2 Projection screening
4.2.3 Contact screening
4.2.4 Photomechanic equipment
4.3 Electronic dot generation
4.3.1 Basic principles
4.3.2 Continuous modulation of halftone dot area
4.3.3 Discrete dot area control
4.3.4 Screen function
4.3.5 Form of a dot
4.3.6 Error diffusion halftoning
4.3.7 Halftoning at lacking the resolution output
Summary issues
Tests
4. Halftoning
4.1 Tone measure spatial dispersion
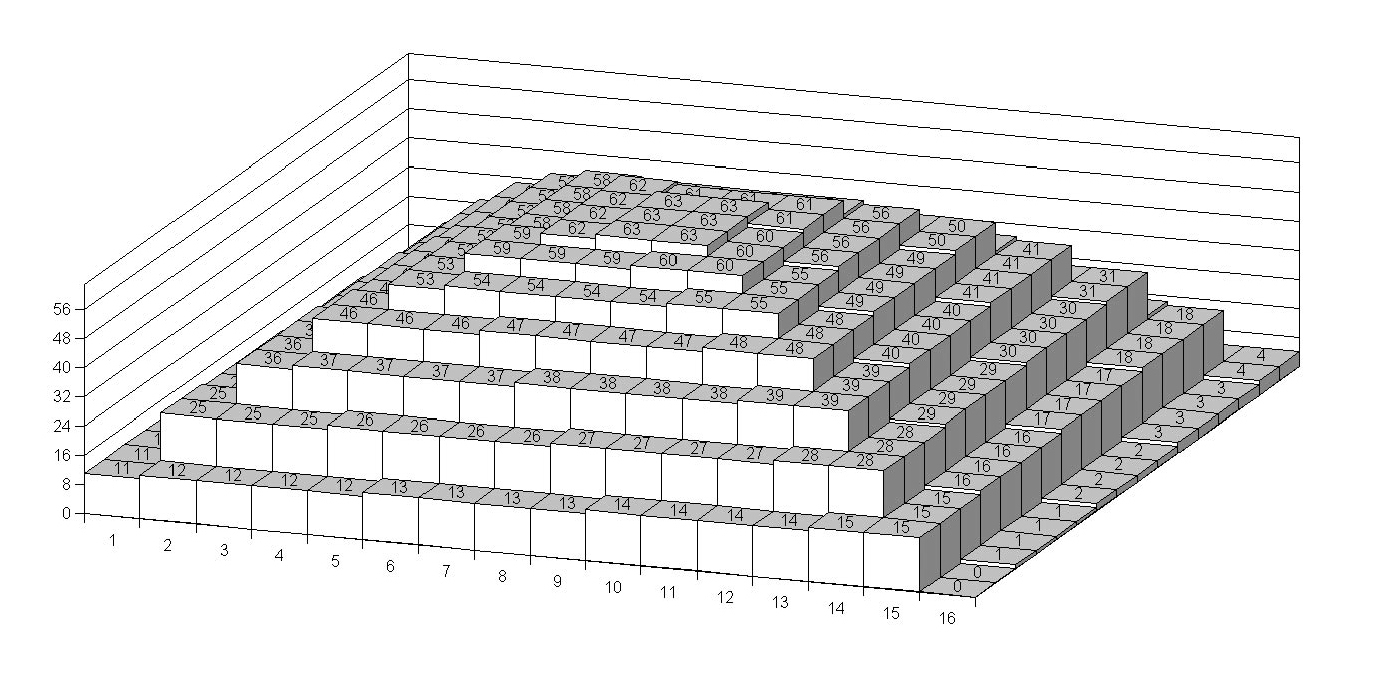
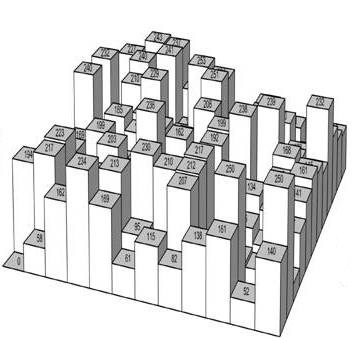
In the certain point of a photograph the value of reflection can vary within its whole range. Similarly, within whole brightness range, the pixel intensity varies on TV screen or computer monitor any of the tone measure quantization levels can be assigned to the certain element of an image file in the so called raster graphics (Figure 4.1 a).
Autotype principle involves the separation of these levels within sampling area, screen mesh or some other print unit portion among the microdots or sub-elements thereof to make their blackening responsible to the difference just between some adjacent tone levels [4.1].
а) b) c)
Figure 4.1. Multilevel tone measure assigned to a pixel in image file (a) is subject to monotonous (b) or random, dither (c) dispersion within some unit area of a halftone copy
Such portion can be discerned on the AM halftones produced with use of the functions similar to that presented in figure 4.1 (b). But it isn’t visually acute on the tint of halftone generated by FM (dither) or error diffusion methods. Nevertheless, some spatial period, within which the reproduction system responses to one level of an image signal, does, in one way or another, exist in any kind of screening.
In the most of the lower discussed digital halftoning methods the levels are distributed as microdots weights of specified screen function. Tone measure can be dispersed periodically with various geometry and law of monotonous increase / decrease (Figure 4.1 b) or in random fashion (Figure 4.1 c). The latter can be uniformly probable, providing the spatial frequency spectra of halftone structure related to the ”white noise”. Filtration by the low band “blue” mask to certain extent excludes the microdots clusters and results in more uniform distribution of print elements and blank spaces.
4.2 Optical methods
4.2.1 Halftoning photo effect
During about a century the halftones were produced by exposure the original through special optical devices – projection and contact screens with the use of so called halftoning photo effect. Along with the variety of masking photographic methods, this, now obsolete technique, had, not too long ago, comprised the basic of prepress image processing. So, it wouldn’t be out of place to briefly describe its essence for further revealing the fundamental differences of the electronic and digital methods currently in use.
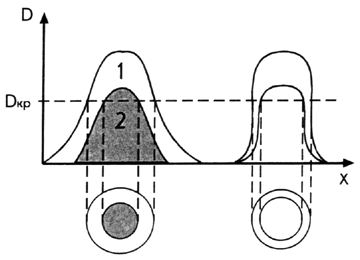
Contrary to the usual photographic effect resulting in the exposure dependant blackening of a sensitive layer, the halftoning photo effect divides the image on separate elements their size being defined by the amount of incident light. Within a unit image area (screen mesh) the dispersion is provided optically, by the intensity redistribution to a pyramidal or bell shape inside the light beam reflected from the related element of an original. At low luminance (from the dark area of original) the sensitive film layer responses just to the central part of such beam where the intensity is yet sufficient for creating small dots on the halftone negative.
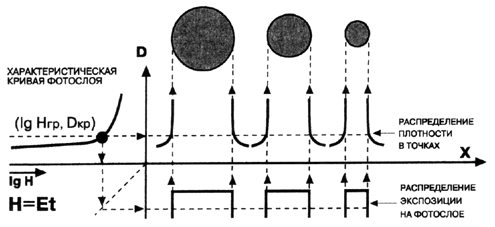
Mechanism for the halftone effect and two conditions of it realization are explained in figure 4.2 with the use of three interrelated characteristics.
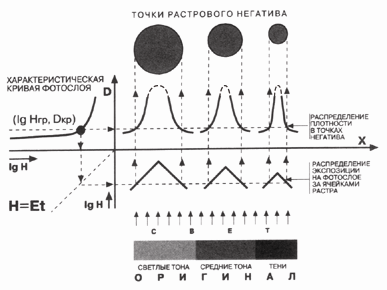
Figure 4.2. Mutual connection the resulting halftone dot size (І), exposure distributions within a screen cells (ІV) and threshold point (Dthr, lgHthr) on film density curve (ІI)
The first of these conditions is in the use of a high contrast, “line work” film with as possible short density range to operate in bi-level, b/w fashion. Its sensitivity curve is presented in the quadrant ІI as the dependence of resulting optical density D and exposure H = Et, where E and t are its luminance and duration.1 For high contrast photographic emulsions this curve has a pronounced kink in the marked threshold point (Dthr, lgHthr) of the transition from the lgH < lgHthr “fog” area to effective exposure range of film blackening. 2
Another condition is the formation of non uniform, excluding П - shape, exposure distributions of bell, pyramidal or any other profile providing the light dispersion for latent image within each screen cell (quadrant ІV).
In quadrant I there are shown the density distributions within the halftone dots on a negative after film processing. Dotted lines with arrows explain the formation of a pair of points for each of these distributions.3 It’s seen that these positions are set by the threshold coordinates Dthr, lgHthr on the film curve II and exposures shape within a screen cell (IV). Such shapes were provided in camera prepress by means of projection and contact screens.
4.2.2 Projection screening
Projection screen is comprised of the opaque stripes produced by inking the grooves engraved on a glass plate. The screen giving not linear, but dot structure of printed and blank elements was obtained by gluing two such plates so that their strokes passed at an angle of 90° to each other.
The non uniform light distribution behind the screen cell can be explained by diffraction and shading theories. According to the latter, its formation is illustrated in figure 4.3, which schematically presents: the camera diaphragm 1, one of screen cells 2 and film layer 3. Relationships of these elements sizes and distances there between define the result of halftone photoengraving and are used in its settings computation. There are also shown below two exposure distributions 5 and 6 in the latent image for utmost illuminations, i.e. for the lightest and darkest areas of an original.
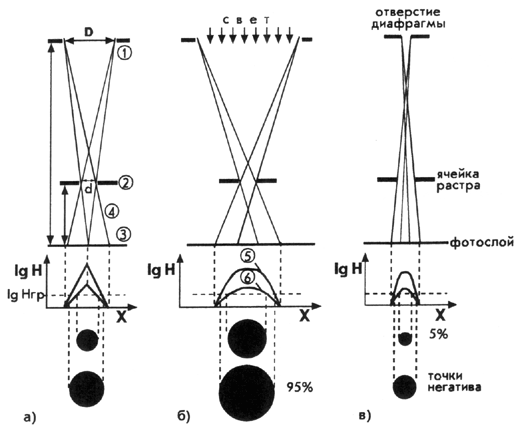
Figure 4.3. Range of halftone dot size variation depends on the camera diaphragm dimension D
It’s seen in figure 4.3 (a) that the maximum amount of light, which has passed through the diaphragm 1, falls on the central part of cell 2. With the transition to the edge of the cell, the number of light rays reaching the photo layer 3 decreases linearly and in the limit there can be specified the point where only one beam 4 falls. From a comparison of schemes a), b) and c) it also follows that the form of light distribution depends on the diaphragm size D.
For elaboration of the whole range of tone values, for example in the range of 5 to 95%, the film was exposed in two steps. The first "partial" exposure was made with a relatively large "light" diaphragm to obtain the greatest dots for “white” of an original in the shadows of a negative (Figure 4.3, b). The second exposure with a small "shadow" diaphragm gave the smallest dots in the light areas of a negative (blanks for “black” of an original), without significant increasing the size of the large dots provided by the first exposure (Figure 4.3, c). This mode of exposing allowed for providing the entire effective range of tone variation on a transparency and thus the proper contrast of a halftone.
The dot area, as seen in figure 4.3, depends on the sizes of a screen cell d and diaphragm D, as well on the distances: diaphragm - film (R) and screen – film (r). R and d sizes are specified by the screen ruling and image scale. Therefore, only the diameter D and the distance r can serve as variable shooting factors.
From the ratio of these variables should follow:
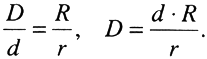 4.1
4.1
In practical calculations of the aperture value and exposure duration, a number of empirical coefficients were also used.
It is appropriate to note here that in addition to adjusting the copy contrast, there were no other options for gradation curve (TRC) form variation within effective range in the projection screening [2.5]. Therefore, the gradation correction was carried out previous to screening by continuous tone photographing of the original with the appropriate selection of the photo layer characteristics, the use of gradation masks, etc.
4.2.3 Contact screening
In the contact method, the photo layer was exposed through superimposed on it film transparency - contact screen (Figure 4.4). In each of screen cells was fixed the image of weight function as two-dimensional periodic distribution of the optical density DCS (x, y), which sets the law of light dispersion. Its one-dimensional (x-axis) slice is shown in figure 4.4 (b), explaining the mechanism of screening effect realization in this method. Blackening (in the form of halftone dots) was obtained on the contrast layer of the negative only where (DORG + DCS) < DTHR.
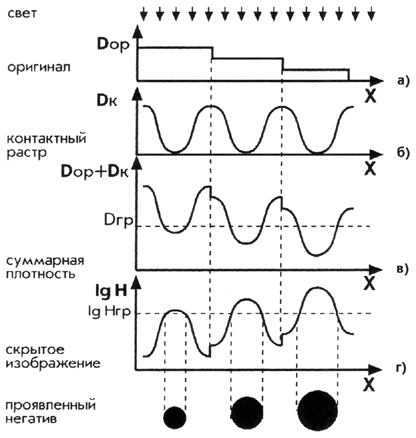
Figure 4.4. Formation of the variable area halftone dots in contact screening
To implement the effective density range, the exposure value, as can be seen from the same scheme, was chosen so as to ensure the formation of dots on halftone negative, for example, with values of 5% and 95% respectively for the black and white levels of an original. Important was also the close proximity of the screen density range ΔDCS to that of the original ΔDORG. Otherwise, differences in the details brightness were transmitted either with low contrast or not in the entire range. More universal in this sense were, in contrast to the neutral (gray), the colored, in particular, purple screens. Their optical density, and hence the range ΔDCS, were different for light of different color and can be adjusted by the filters selection when screening black and white originals.
The exposure distributions in the latent image on the photo layer, similar to those shown in Fig. 4.4 (d), was also possible to receive in two steps. First the film was exposed through a projection or contact screen without the original. Thus obtained pre-screened film could be delivered centrally for mechanicals producing in cameras and contact-copying frames without the use of optical screen.
TRC form in that kind of screening is defined by the density distribution within a screen unit cell. Example of three exposure values for three different type of screens in figure 4.5 conditionally explains how at the same utmost dot sizes the different form of such distribution provides the unlike gradation (halftone dot area) in the midtones.
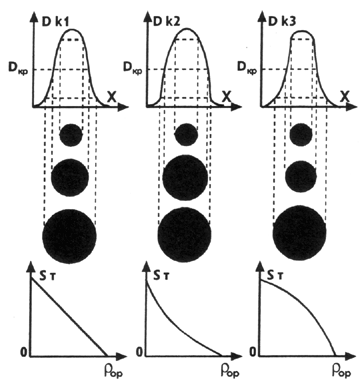
Figure 4.5. Effect of the optical density distribution in a contact screen cell on the TRC form.
Contact screens were widely used for the halftone transparencies recording by xenon lamps and lasers also in the first generations of electronic scanners.
Their nomenclature, in contrast to projection analogues, was wide enough to allow more flexible control of reproduction parameters. They differed not only in ruling, but also in the range of densities and their distribution in cells (the form of TRC), the substrate color (gray and purple), the structure geometry and orientation, the dot shape and other parameters. There were also the screens with the specific geometry aimed on achieving the special effects as shown in figure 4.6.
Figure 4.6. Image from Polychrome pamphlet for the contact screens with special effects.
4.2.4 Photomechanic equipment Central to the range of photomechanical equipment was large format cameras. According to the location of the basic optical elements they were vertical and horizontal. In the first of them, the table holding an original was in the horizontal plane, above which the lamp, lens, filters, screen, film cassette and other components were located (Figure 1.5 a).
The optical channel of the second type cameras was horizontal (Figure 1.5, b). "Light room" camera was equipped with a lightproof cassette filled with film in a dark room. The lamps and original holder of the "two-room" cameras were located in a bright room, while the exposed part with photographic material was in a dark one, where the film photochemical processing was carried out.
The latest models of these devices were comprising high-performance systems, equipped with light meters, digital means for exposure calculating, automated control for diaphragms and shutters, color filters replacement, focus adjustment at given magnification, as well as with vacuum suction of film and contact screen. A number of such complexes were equipped with systems of automatic supply of photographic material and its output to the developing machine with control systems of such parameters of chemical solutions as their concentration, temperature, mixing intensity, as well as means of densitometric control of film processing.
In most cases, the fast development technology (Rapid Acsess Process) was used, in which the "from dry to dry" time was 1.5 - 2.0 min., due to the increased temperature of the solutions and the use of films with a heat withstanding base [4.2]. To improve performance, processors were linked in a production line with cameras as it’s nowadays done for imagesetters and CTP devices.
Auxiliary photomechanical equipment includes a contact-copying frame for image transfer from one film to another with change of polarity (negative to positive and vice versa), accompanying such transfer. This additional operation, caused, for example, by obtaining a positive from the first (negative) halftone in relation to the production of litho plates of positive copying, was accompanied by a double consumption of expensive (silver-containing) film.
Contact-copying was also widely used for the selective addition or subtraction of the CT transparencies densities in the procedures of gradation and color correction masking, as well as for images cropping and combining.
Obtaining halftone transparencies of different polarity by such copying was necessary for their manual local retouching. Reduction of the dots size was provided in it by etching, but for their increase the etching solution has to influence a negative.
The mechanism of etching of halftone dots on the film is explained in figure. 4.7. "Proportionally" acting solution reduces the optical density at approximately the same value over dot area. The potential of such retouching was estimated by the so-called correcting effect as a tone value by which the dot could be reduced. For un-sharp, “soft” dots such facility is higher and therefore conflicts with the further discussed copying properties in plate making. The “hard” dots of a П - shape density distribution, having the perfect copying properties, do not at all possess the effect of such correction.
|
Figure 4.7. Optical density distributions within the halftone dots previous to (1) and after (2) the transparency etching with effect depending on the dot edge sharpness “Step-and-repeating” camera was intended for multiplication of the small-sized color-separated halftone transparencies (postcards, labels, etc.) by consistently positioning its exposing head on specified areas of film of a press sheet format. |
|
Retouching desk, being at the same time a device for visual control of transparencies, had the base made of "milk" glass, with an internal uniform illumination. Larger dimension has the similar table to assembly on a transparent base of a press sheet format the films of pages with text and illustrations layout, films with the register marks and the plate making and printing control elements. In the assembly of films for multi-color printing, special attention is paid to their size matching and placement accuracy, since the deviations would blur the image and are fraught with the appearance of moiré after statistical summing up with the paper sheet register errors on a press. Essential tools for visual and instrumental inspection of mechanicals in the retouching and assembly are a lens, microscope and transmission densitometer. Retouching, pages layout, assembly, transparencies multiplication, auxiliary control elements generating are provided today automatically by digital data processing. With the proper format of CtP output the final plate is produced with the complete bypassing the film processing stage.
4.3 Electronic dot generating The screening systems development is aimed on improving the prints microstructure and increasing their information capacity. Problems of choice the halftoning procedure which would be adequate the reproduced original nature and printing specifics arise mainly due to the lack of clear evaluation criteria and correct basis for comparing the different techniques. Many characteristics of traditional, limited in their nomenclature screens require rethinking and definition in the light of modern information technology, which is hampered, in particular, by not yet well-established terminology. The most discussed issues of the screening which would match the particular kind of printing are: - dot gain; - tone rendition and its control facilities; - resolution; - degree of contours and fine detail distortion; - possibility of moiré and false patterns appearance; - visual uniformity of resulting print structure; - required resolution of image input (source file volume); - complexity of the algorithms used.
4.3.1 Basic principles In the electronic dot generating (EDG) the autotype principle is realized bypassing the photomechanical screening effect to get a more rigid connection between the print element size and image signal value [4.3]. The halftone dot area is, as result, less critical to the deviations of exposure, film contrast and processing conditions (development time, concentration, temperature, mixing intensity of the developer), which, in turn, highly effects the critical point position (Dthr, lgHthr) in figure 4.8. These instabilities affect mainly the dots density, and not their size as the ink coverage on the future print. High copying properties are achieved in this case on ordinary high-contrast layers, regardless of the unstable, "infectious" development required to get “hard” dots in projection or contact screening. Image of desired size dot is formed in the optical path of the recorder.4 By analogy with the scheme in figure 4.2, explaining the photomechanical screening effect, the formation of variable area dots in electronic method is illustrated by the diagram in figure 4.8.
Figure 4.8. In electronic dot generating, the displacement of the critical point (Dthr, lgHthr) due to the exposure or chemical processing deviations does not affect the halftone dot size due to the П-shaped exposure distribution rigidly set in the optical channel
П -shaped exposure in the latent image correspond to a similar form of dot density distribution after the film development and is provided in ways of the continuous and discrete dot area control.
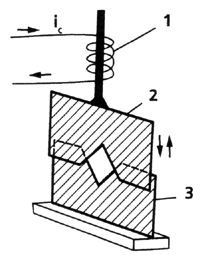
4.3.2 Continuous modulation of halftone dot area A simplified example of continuous spatial modulation as a control of the area of the exposing light spot comprising the image of a halftone dot explains figure 4.9. The signal current, in the winding of the electromagnet 1, controls the degree of mutual overlap of the movable 2 and fixed 3 parts of the diaphragm. To obtain dots of circular shape, a drive of the so-called iris diaphragm can be arranged in a similar way.
Figure 4.9. Electromagnetic diaphragm for controlling the area of the exposure spot – image of a halftone dot
A significant mass of mobile elements limits the speed of such drive, so only devices with relatively low-inertia “mirror galvanometers” have found practical application in Time-Life PDI scanners [4.4; 4.5]. The systems with CRT were non-inertial in this respect. Halftone dot were formed in them either by a spiral or rectangular scan of an electron beam controlled by a video signal [3.2; 4.6], by defocusing this beam [4.7] or modulating its cross section with an electric field [4.8]. Systems with magneto-optical control of the shape and area of the exposed spot created by the laser beam were also proposed [4.9]. Continuous modulation of the dot area is carried out until now in the electro-mechanical engraving of the gravure cylinders or laser burning holes in the "master film" of digital screen printing.
4.3.3 Discrete dot area control Discrete control of the ink coverage within a unit area of the halftone image began to prevail in the scanners with the development of digital techniques and is now widely used in computer publishing systems that integrated the text and illustrative data processing. In this regard, electronic screening with the above-mentioned continuous control of the dot area is sometimes called analog, while one with its discrete variation - digital. The whole alphabet of halftone dots can be represented by a set of bitmaps, quantitative ratio and relative location of “0” and “1” in which determines the area and shape of future print elements and blank spaces (Figure 4.10). To compensate for the dot gain, a different bitmap from the existing set is assigned to the tone value, and with limited selection, the proper tone rendition is achieved using a different set of symbols.
|